

- Water Quality Mapping
GIS Analysis / ArcGIS Pro
*Full resolution images available upon request
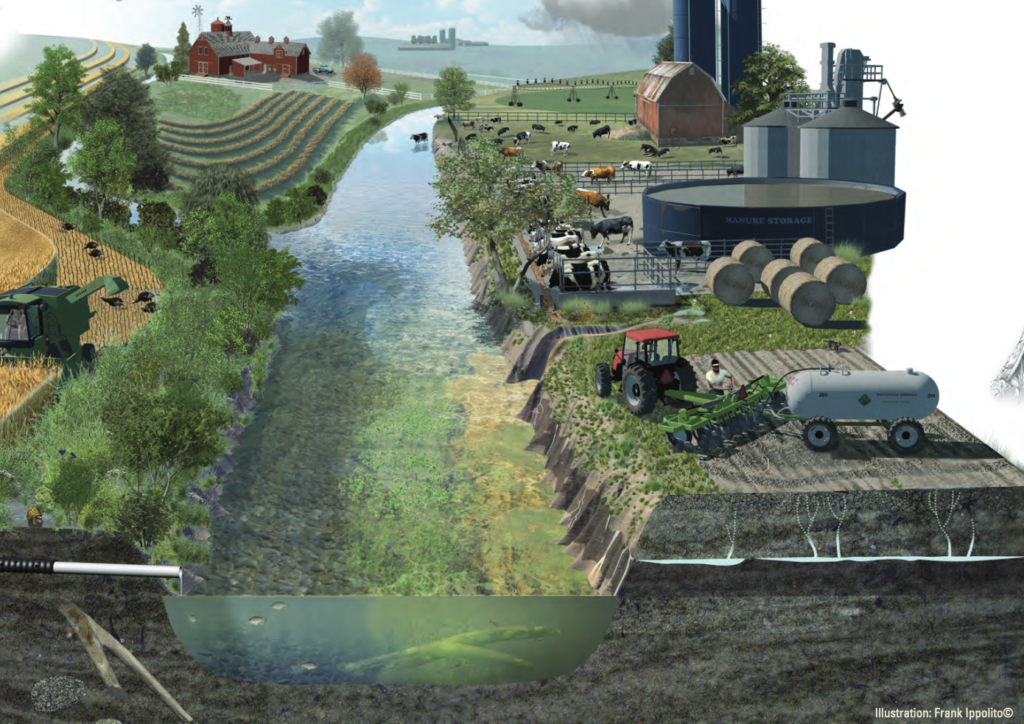
Assessment of Agriculture Runoff and Water Quality Conditions in California.
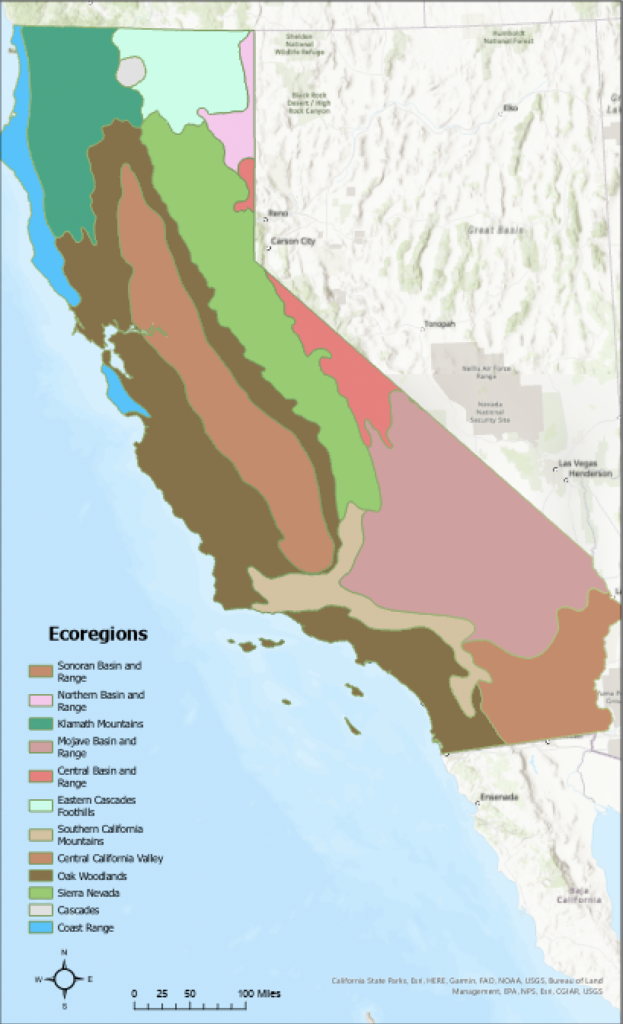
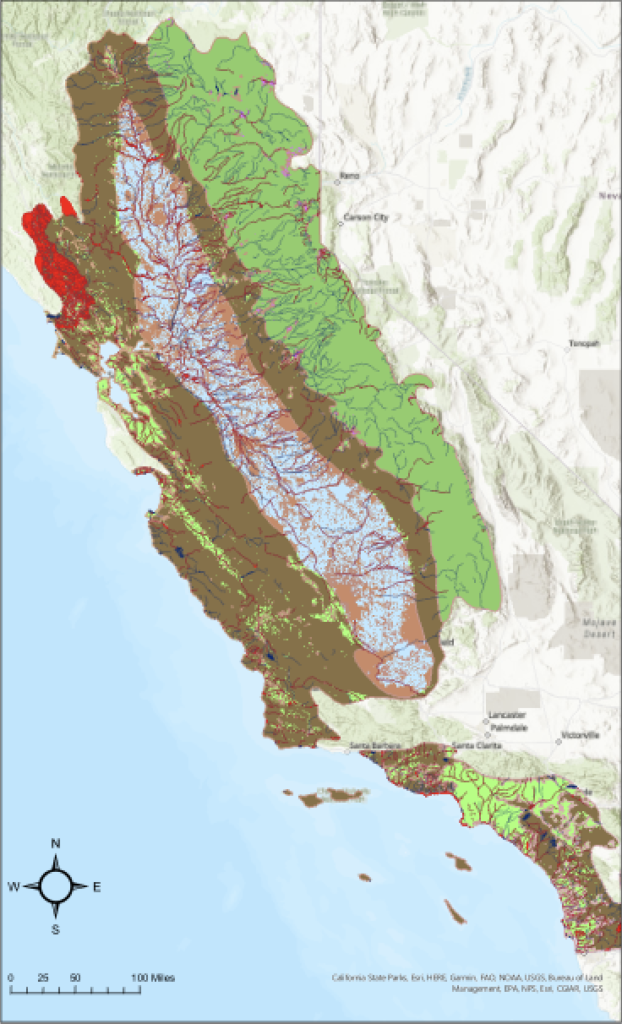
Ecoregions denote areas within which ecosystems are generally similar.
For this project we will focus on the Oak Woodlands, the Central California Valley, and the Sierra Nevada as these areas have the highest density of farmland.
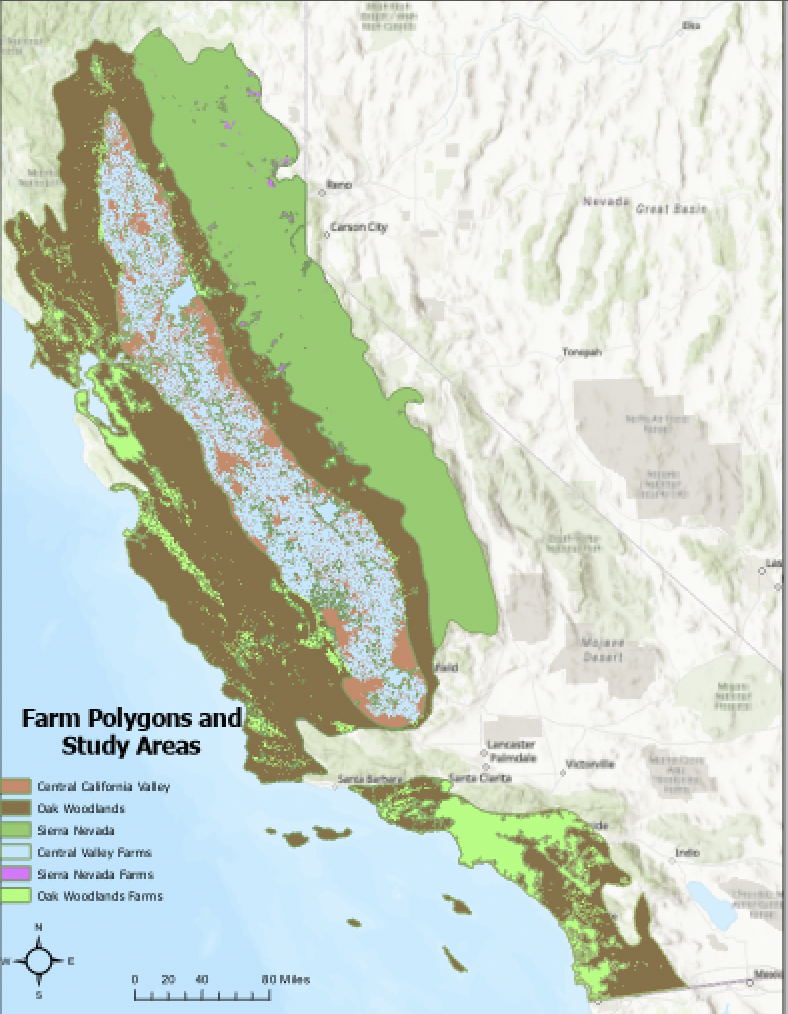
The map indicates farms in the Oak Woodland, Central Valley, and Sierra Nevada ecoregion.
Oak Woodland = 30,659,350 acres of farmland
Central Valley = 7,897,005 acres of farmland
Sierra Nevada = 260,487 acres of farmland
Upon compiling our datasets into a single visual representation, we were able to infer that farmland density plays a significant role in the amount of impaired waterways an ecoregion contains.
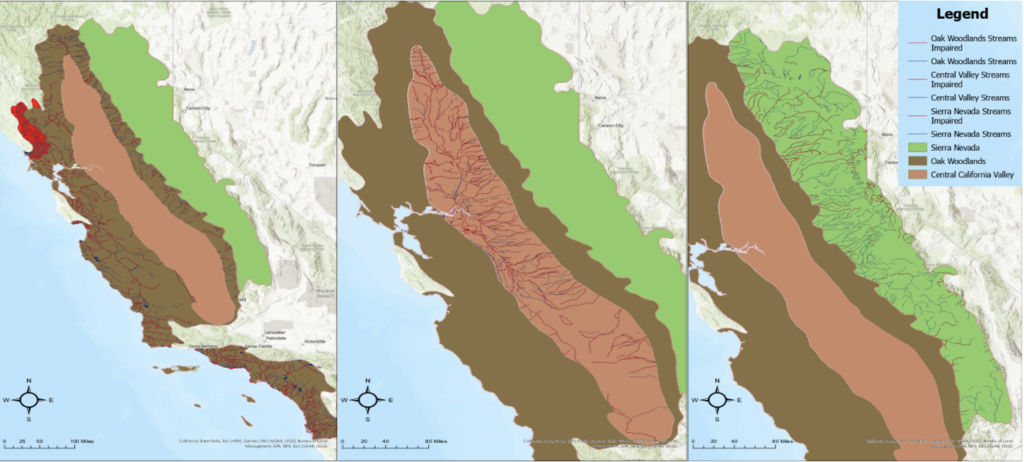
Streams indicated in red on the map are considered “impaired” due to the large amounts of pollutants found in the water. Streams in blue have not passed the threshold to be considered “impaired” and are considered healthier.
Data for this project was obtained from two primary sources; The California Natural Resources Agency provided vector data pertaining to farmland polygons and the United States Environmental Protection Agency (EPA) provided data detailing watershed shapefiles and water quality assessments.
Data is projected in ArcGIS Pro using the WGS 1984 Web Mercator (auxiliary sphere) and was then clipped to focus on the study area. The summarize table tool was employed to calculate statistics for significant figures related to area (acres) and length (miles). “Impaired” or polluted waterways were identified and visually represented by selecting by attribute to create an independent layer. After these figures were revealed and displayed on the map it became clear the magnitude of the issue of agriculture runoff and the quality of the state’s waterways.
Both the Oak Woodland and Sierra Nevada ecoregions roughly contained a 70% impairment rate despite the Oak Woodland consisting of about four times the amount of farmland as that of the Central Valley.
The Sierra Nevada ecoregion, containing the lowest density of farmland maintained a 30% impairment rate.
Techniques to Mitigate Pollution
- Constructed wetlands: cost-efficient, long-term, highly effective tool to reduce nutrients exiting fields that could otherwise affect local waterways. Wetlands on farms can remove a significant amount of excess nutrients from runoff and, if applied at scale, can have a huge positive impact on water quality.
- Ensuring Year-Round Ground Cover: Farmers can plant cover crops or perennial species to prevent periods of bare ground on farm fields when the soil (and the soil and nutrients it contains) are most susceptible to erosion and loss into waterways.
- Managing Livestock Access to Streams: Farmers and ranchers can install fence along streams, rivers and lakes to block access from animals to help restore stream banks and prevent excess nutrients from entering the water.
2. Geothermal Luxuries
ArcGIS Pro / Canva / Adobe Photoshop
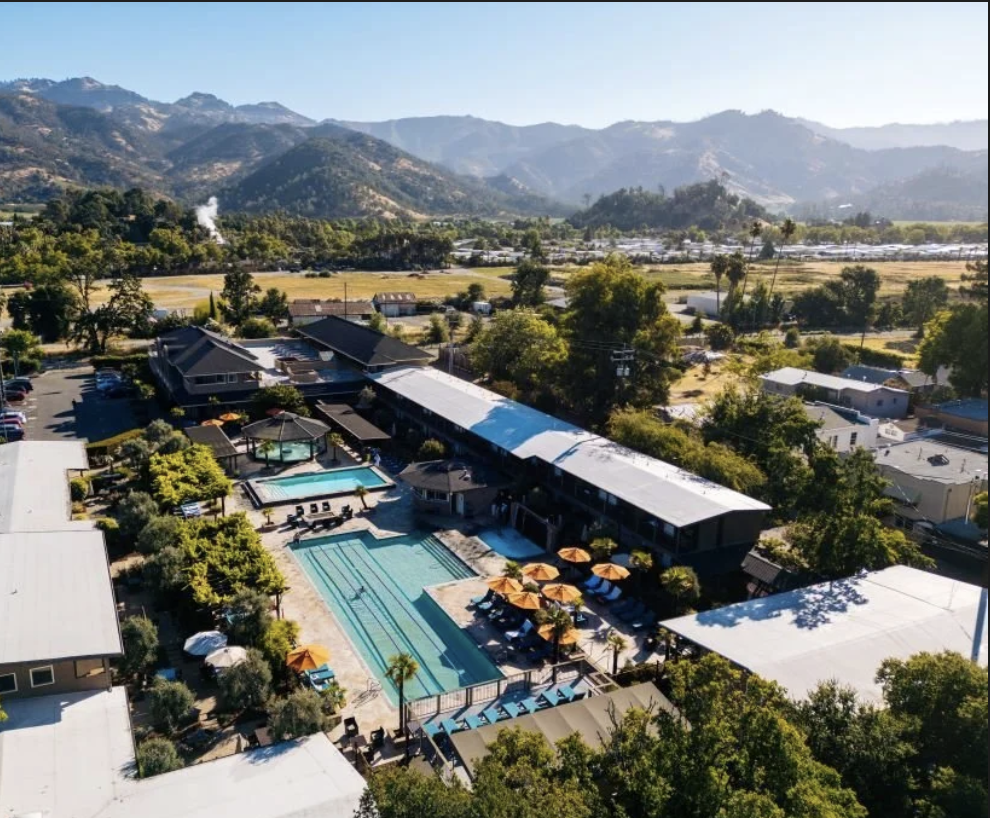
Fertile Volcanic Soil and Mineral Based Hot Springs in Calistoga, California
Calistoga sits at the northern end of Napa Valley above a geologically active zone where volcanic history shapes both the land and the local economy. Heat rising from below the surface brings mineral-rich waters upward, influencing soil composition and feeding the natural hot springs the town is known for.
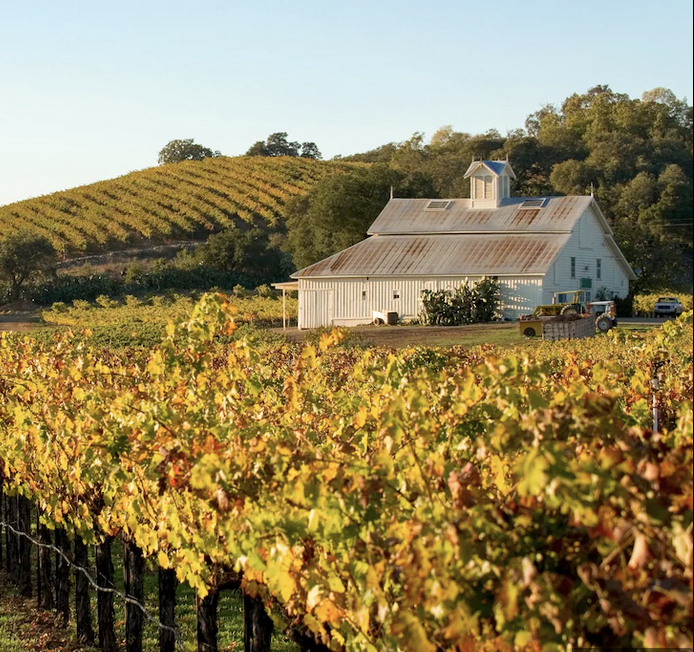
Volcanic ash and mineral deposits carried upward over time add nutrients such as potassium, magnesium, and iron to the ground. Combined with Calistoga’s warm climate, this creates favorable conditions for growing wine grapes, particularly robust varieties like Cabernet Sauvignon and Zinfandel.
The same underground heat that creates fertile soil also feeds natural mineral springs throughout the area. These springs emerge at the surface as warm, mineral-rich waters that have been used for relaxation and wellness for over a century — making Calistoga a rare place where award winning wineries and mineral spa resorts exist within walking distance of each other.
This project called for a custom map that captured that character, so we decided to make a fun design based map showing the locations of a few of our favorite wineries and spas in the area.

Using Canva, we illustrated simple yet elegant map symbols to represent the locations of our favorite destinations in Calistoga. One depicting a chateau and vineyard and the other depicting a relaxing mineral bath.

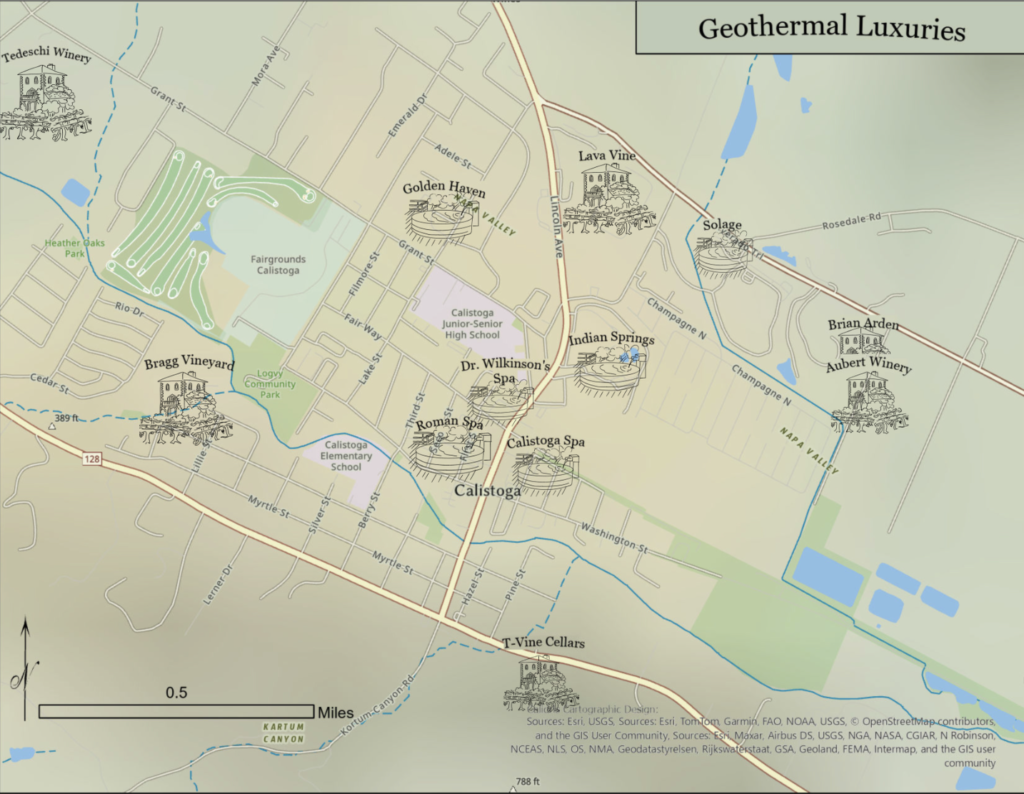
After finding publicly available geospatial data containing the addresses and coordinates of our favorite Calistoga destinations, we compiled this information into a map on ArcGIS Pro. Next we selected a suitable basemap to fit the style of map we were aiming for and created labels for our chosen destinations. In Adobe Photoshop we imported the custom map symbols we created on Canva and assigned them each to their location.
A large scale bar set to a half mile was chosen deliberately to communicate the town’s walkability and the density of destinations within easy reach of the town center. The result demonstrates a full multi-tool design workflow: spatial analysis and basemap work in ArcGIS Pro, original symbol illustration in Canva, and final layout and compositing in Photoshop.